project background
About
Bristol is a city built on the rise and fall of the tides. Historically, the tides would make their presence felt, right in the heart of the city, lifting boats up to the quaysides at high water and stranding them in the mud below at low tide. From the beginning of the 19th century, however, with the creation of the Floating Harbour, the water level was kept constant and that connection was lost. ‘Tidelight’ symbolically re-established that dynamic connection between the city and the sea.
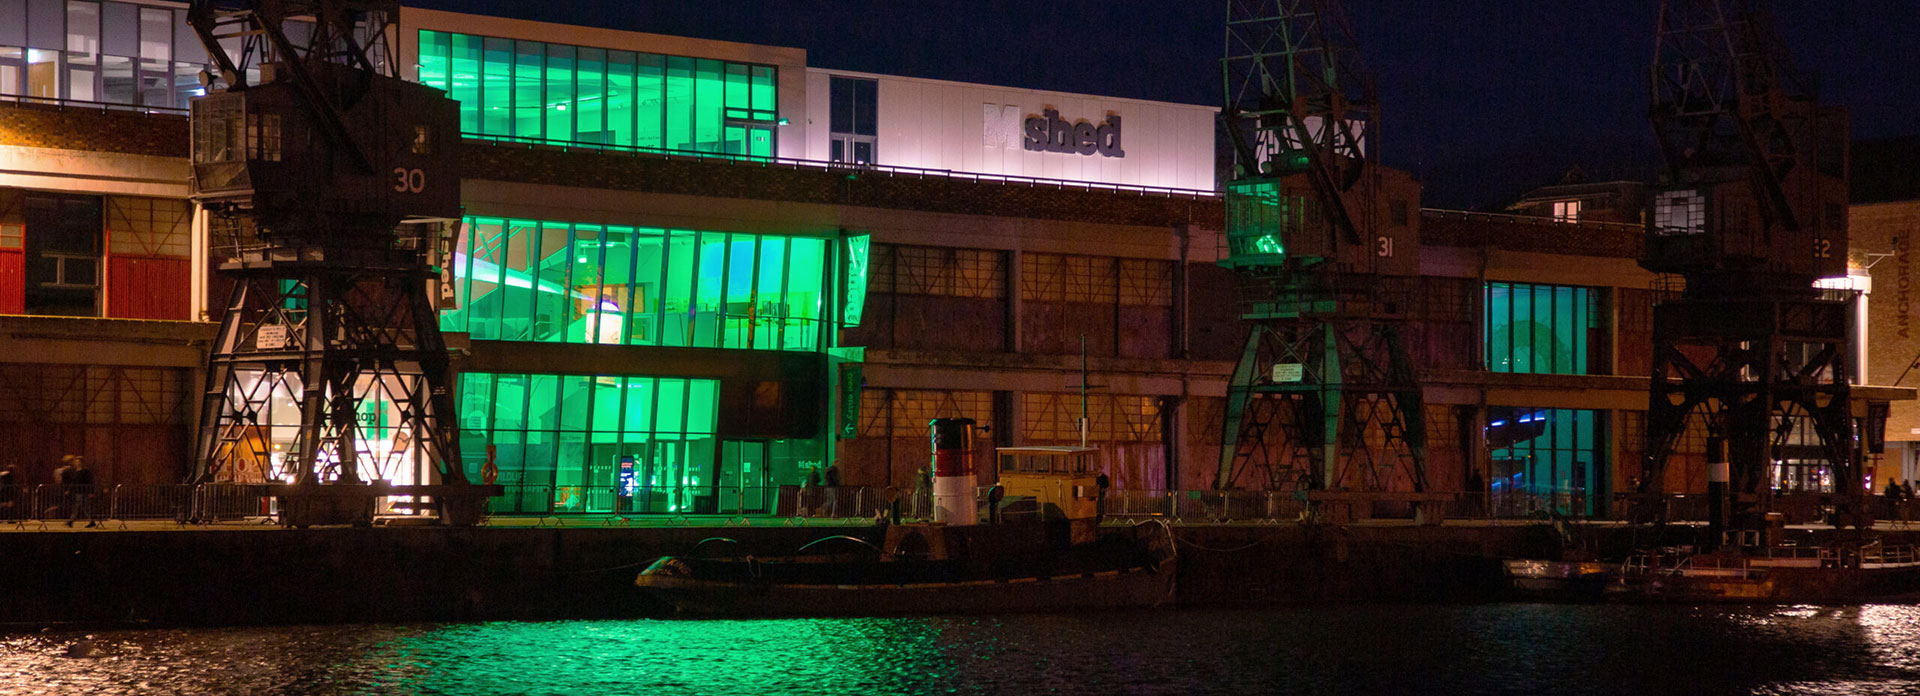
The interior of Bristol’s glass-fronted M Shed museum was filled with light that changed colour in direct response to the rise and fall of the tides. At night the whole building became a giant ‘lantern’ on the waterfront, responding to the sea beyond.
To make Tidelight happen, continuous, real-time water level data from tide gauges out in the Bristol Channel was sent back to a computer inside the building. A piece of software converted this data, on-the-fly, in to a form that directly controlled the colour value of RGB lighting, already installed throughout the building as well as additional temporary lighting in the glass fronted foyer.
Very low water was translated in to red light. As the water rose on the turn of the tide, the sensor data gradually caused the hue to transition through shades of orange, yellow, green and blue, all the way to violet at very high tide. The full tidal range out in the Bristol Channel corresponded to the full colour spectrum.
As the tidal ranges vary over time, so more or less of the spectrum was reproduced accordingly. During a neap tide, the tidal range is low. The high tides are less high and the lows less low.
On these occasions the coloured lights in M Shed may only ranged between orange and green. On a very high spring tide, though, the building was lit in a particularly intense violet, and during particularly low spring tides, the ‘lantern’ glowed a deep, blood red.
Prior to the construction of the Floating Harbour (completed in 1809), the river Avon was completely tidal with water rushing up and down the river channel creating huge variations in water level right in the heart of the city. With the construction of the floating Harbour, the water level was kept constant in the commercial centre of the city. The river was diverted to the south in to the New Cut. The rise and fall of the tides can still be seen in this channel just south of M Shed. This map excerpt is from Rocque’s survey of the City of Bristol of 1750 held at Bristol Museum & Art Gallery.
The history of Bristol’s waterfront environment can be traced through maps using the interactive tool, Know Your Place
Bristol’s connection to the sea has always been a big part of its identity. And the coming and going of the tides has been inextricably woven in to its story. From John Cabot and his crew waiting for the tide to lift the Matthew off the mud to allow passage along the Avon Gorge – and out beyond the Bristol Channel in to the blue toward that infinite horizon.
To the tides that determined the passage of ships in and out of Bristol during the most shameful chapter of its history – the Transatlantic Slave Trade. To the network of connections, across the globe, of legitimate trade, that brought such a rich diversity of people, objects, ideas and innovations to the city.
All these things, brought in on the rise and fall of the tide are woven in to the fabric of the contemporary city. In the place names, in the buildings, in the quaysides, in the diverse communities, in the music, in the food, in historic works of art and works of contemporary street art.
This project aimed to be a small part of this ongoing story of Bristol’s connection to the sea, as an inland maritime city, and prompt conversations about its history, its geography and our vulnerability to rising sea levels in the face of climate change.
Occasionally, on extremely high tides parts of the Floating Harbour are overtopped and areas of the city become flooded. If this were to occur during Tidelight’s run, the lights at M Shed would glow a particularly intense violet in response, reflecting the extreme conditions that would be clear to see.
The colour range of the lights will be set so that they can potentially respond to sea levels beyond the highest tides ever recorded at Bristol. This gives Tidelight a latent capacity to translate in to colour, future sea level rise scenarios. Image from Chris Bodle’s Watermarks Project